
1、部署prometheus监控平台
安装部署prometheus服务监控端
监控一个远端机器(linux/windows
监控一个服务:mysql
部署prometheus服务监控端
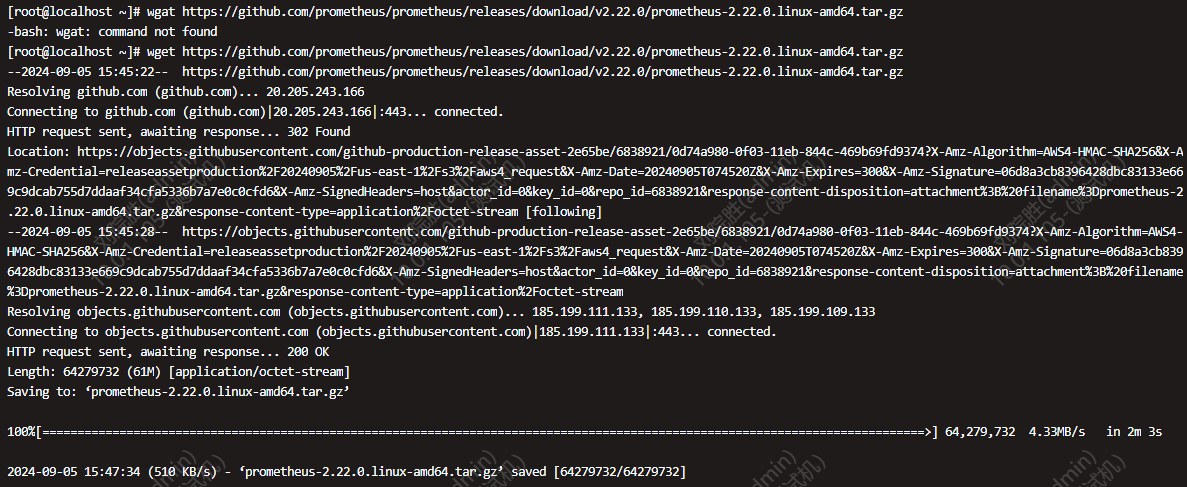
# 下载prometheus 主程序包:
官网:https://prometheus.io/
Wget https://github.com/prometheus/prometheus/releases/download/v2.22.0/prometheus-2.22.0.linux-amd64.tar.g
#解压缩文件:
tar xzvf prometheus-2.22.0.linux-amd64.tar.gz -C /opt/
cd /usr/local/prometheus-2.22.0.linux-amd64/
#重命名
[root@localhost opt]# mv prometheus-2.22.0.linux-amd64/ prometheus
#启动prometheus
./prometheus –config.file=prometheus.yml –web.max-connections=512 –web.read-timeout=5m –storage.tsdb.path=/apps/softwares/data/ –query.max-concurrency=20 –query.timeout=2m &
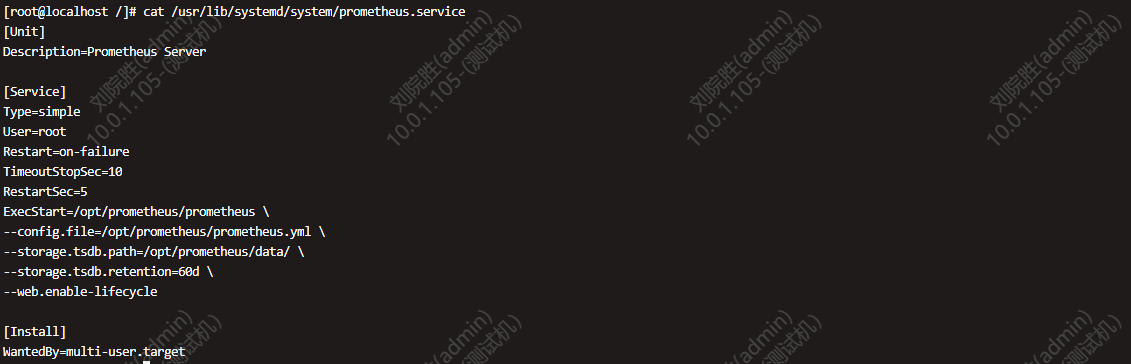
也可配置systemd服务 用systemctl来管理prometheus
[root@localhost /]#vim /usr/lib/systemd/system/prometheus.service
[Unit]
Description=Prometheus Server
[Service]
Type=simple
User=root
Restart=on-failure
TimeoutStopSec=10
RestartSec=5
ExecStart=/opt/prometheus/prometheus \
–config.file=/opt/prometheus/prometheus.yml \
–storage.tsdb.path=/opt/prometheus/data/ \
–storage.tsdb.retention=60d \
–web.enable-lifecycle
[Install]
WantedBy=multi-user.target
配置完后 启动
[root@localhost /]# systemctl daemon-reload
[root@localhost /]# systemctl start prometheus.service

#如果开启了防火墙(未开启请忽略),请添加防火墙策略:
firewall-cmd –zone=public –add-port=9090/tcp –permanent
firewall-cmd –reload
查看web界面是否正常
监控指标:
http://10.0.1.105:9090/metrics
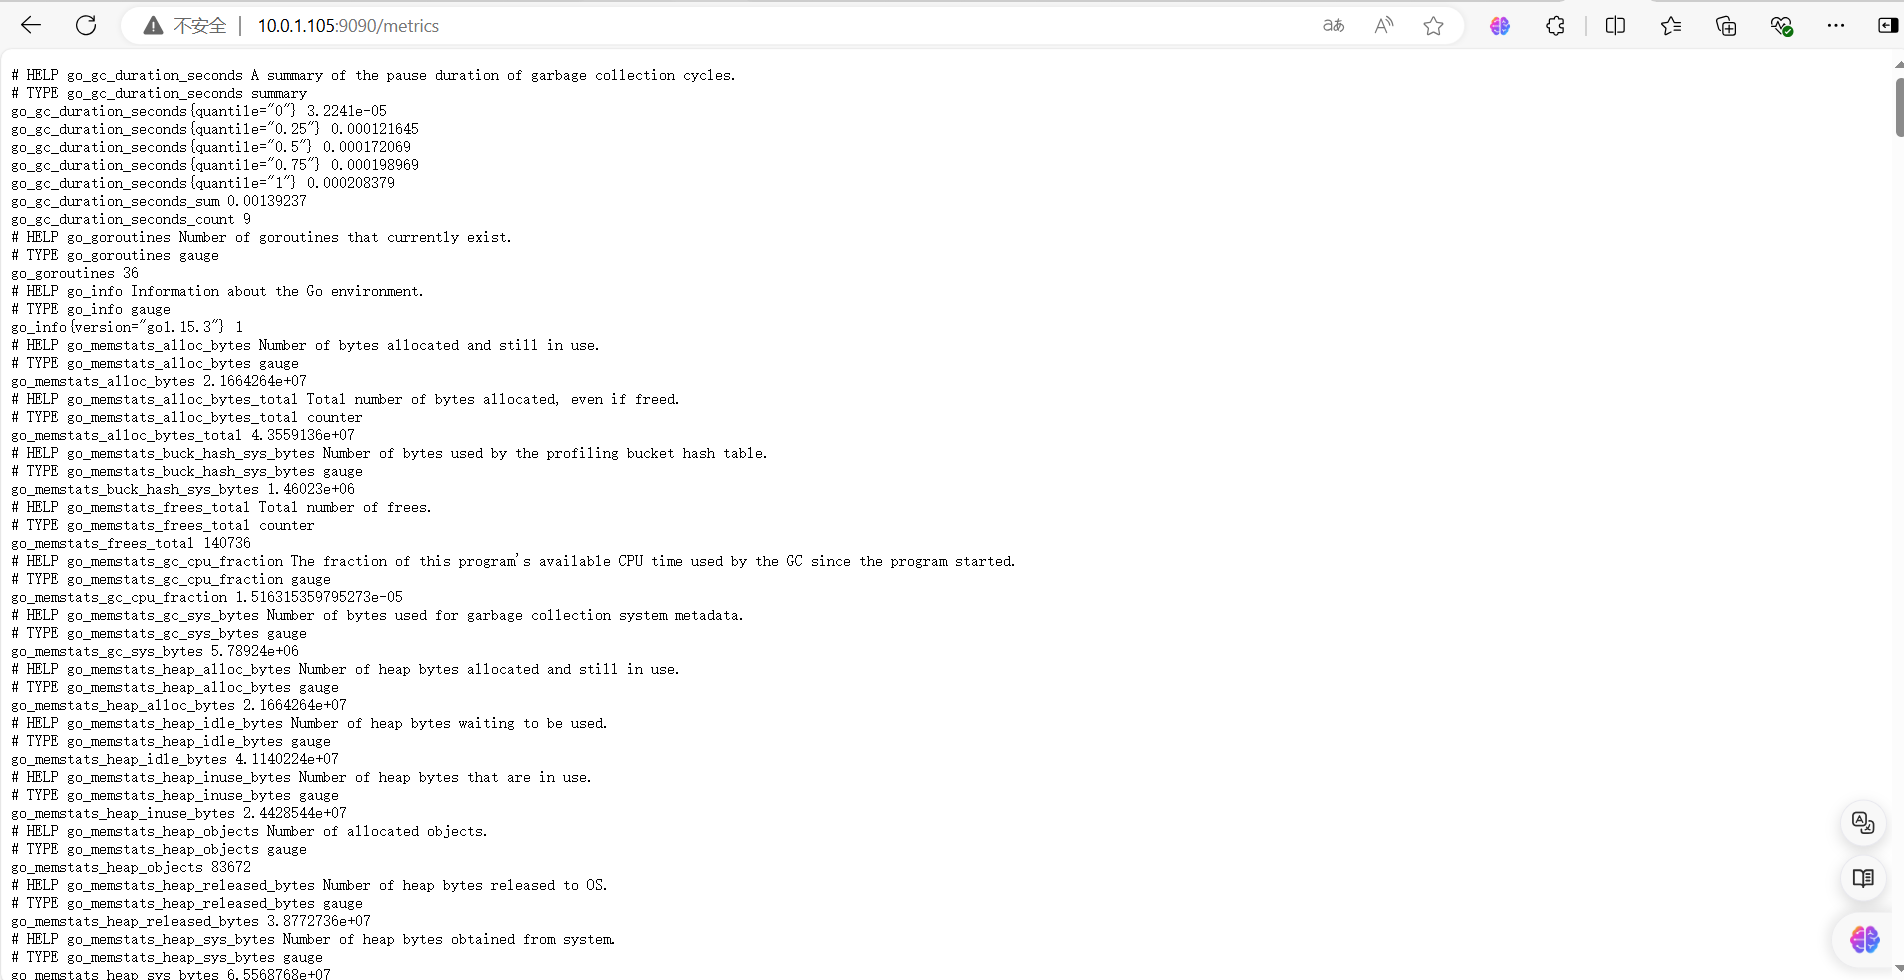
在浏览器中输入http://服务器IP或者域名
:9090/metrics
查看监控数据,通过这个
URL我们可以知道
prometheus
把监控的数据都统一存放在一起
,
生成了一个
web页面,用户通过
web
页面查看相关的数据,
prometheus
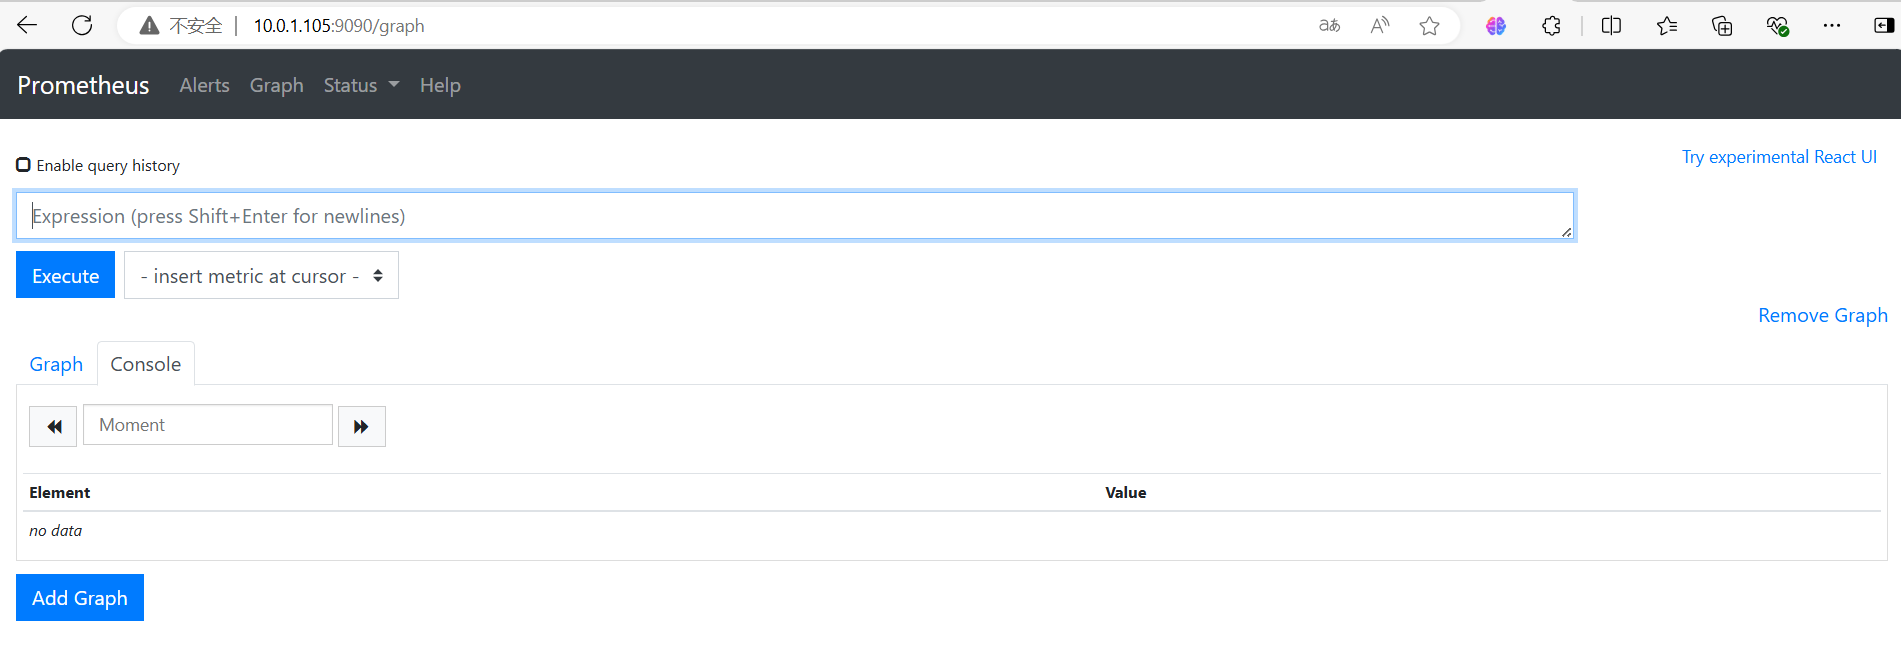
显示同样也提供了图表,通过点击
Graph
可以显示到下列图表,在搜索栏中输入关键字可以匹配出你想看的监控项。

process_cpu_seconds_total指标显示CPU使用状态表,点击下Execute(执行)点击下Graph(视图)按钮,显示当前CPU使用状态图标(默认在console按钮页面)。
2、监控一个远端linux主机
#远端主机监控插件(类似于zabbix-agent): 可直接下载也可以去官网进行下载:https://www.prometheus.io/download/
或直接去https://github.com/prometheus/node_exporter/releases/download网站下载

#进行解压缩
[root@localhost ~]# tar xzvf node_exporter-1.8.2.linux-amd64.tar.gz -C /opt/
[root@localhost ~]# cd /opt/node_exporter-1.8.2.linux-amd64/
#启动监控组件(丢到后台运行)
[root@localhost opt]# nohup /opt/node_exporter-1.8.2.linux-amd64/node_exporter &
#查看组件端口:

#如果开启了防火墙(如未开启请忽略),请添加防火墙策略:
firewall-cmd –zone=public –add-port=9100/tcp –permanent
firewall-cmd –reload
#验证 http://被监控主机名称:9100/metrics

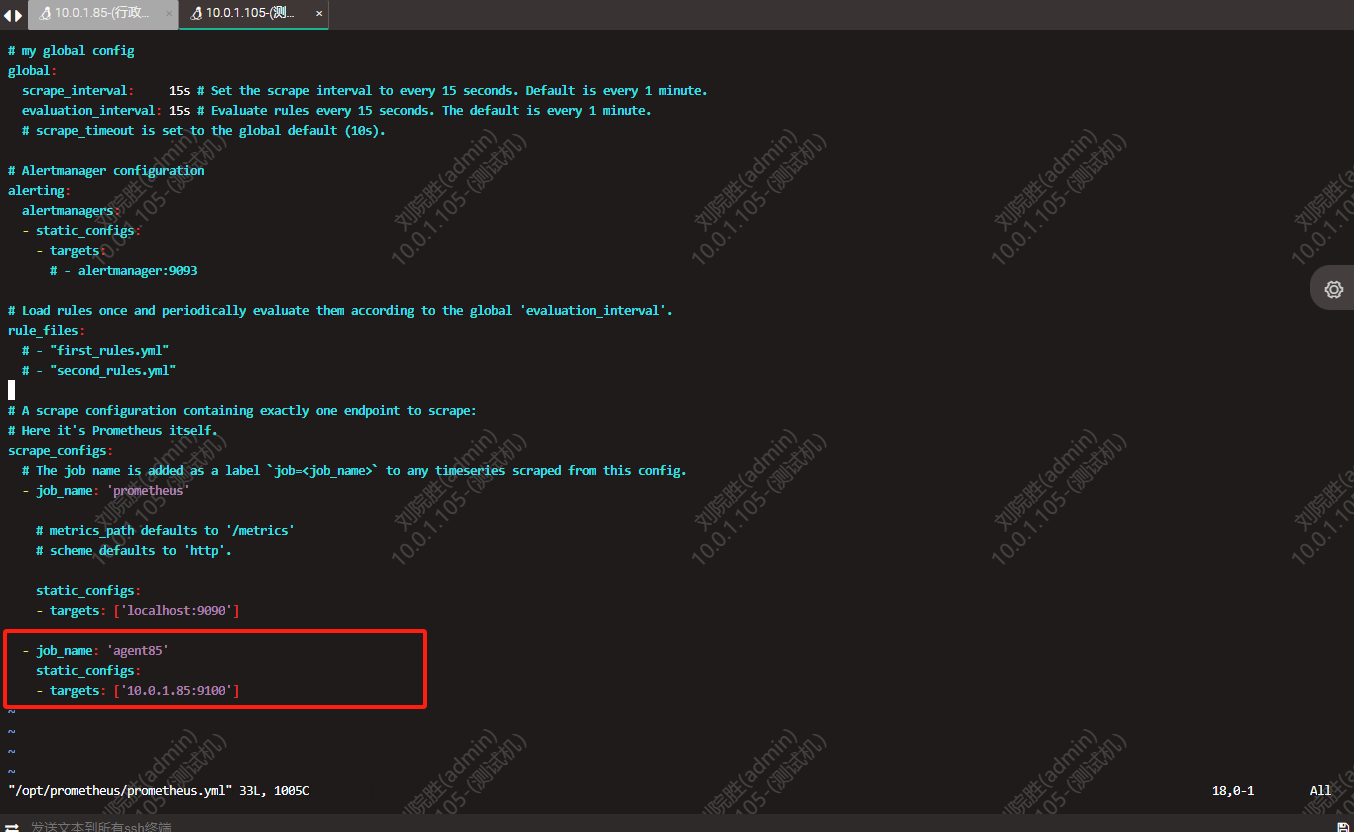
//修改配置文件,最后加上这三行,取一个job名称来代表被监控的机器
[root@localhost prometheus]# vim prometheus.yml
– job_name: ‘行政虚拟机’
static_configs:
– targets: [‘10.0.1.85:9100’]//这里改成被监控机器的IP,后面端口接9100,注意yml脚本中不能出现空格需要对齐。
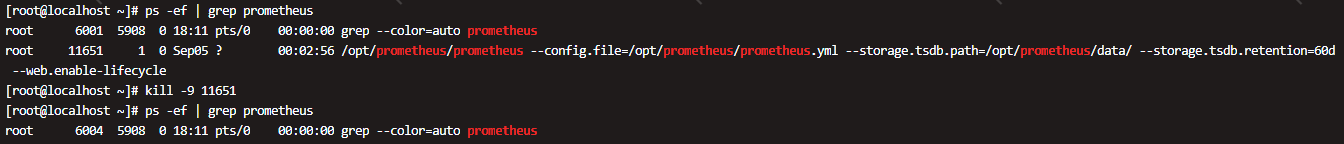
//杀掉进程
[root@localhost prometheus]# ps -ef | grep prometheus
[root@localhost prometheus]# kill -9 11651
[root@localhost prometheus]# ps -ef | grep prometheus
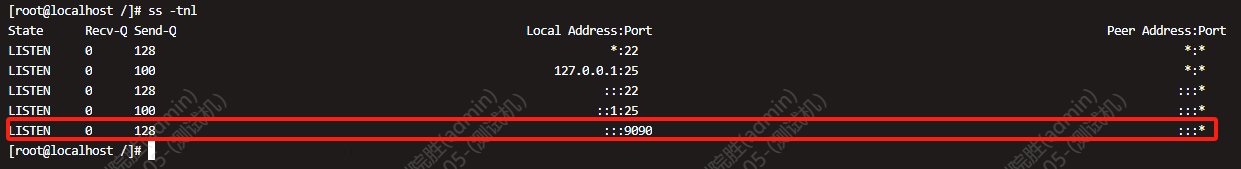
//重启服务
[root@localhost /]# systemctl restart prometheus.service
[root@localhost /]# ss -tnl
回到web管理界面 –》点Status –》点Targets –》可以看到多了一台监控目标

- 监控一个服务:mysql
监控mysql需要两个条件,一是系统中有mysql,另一个是要有监控插件,现在监控插件已经下载好了,所以需要先安装mysql,然后进行相应的授权,让插件可以获取到所需要的信息,然后再设置相关插件,且已经启动mysql。

部署监控插件
[root@localhost ~]# tar -xzvf mysqld_exporter-0.15.0.linux-amd64.tar.gz -C /opt

[root@localhost /]# vim /opt/mysqld_exporter-0.15.0.linux-amd64/.my.cnf (创建.my.cnf文件)
[root@localhost /]# ls -la /opt/mysqld_exporter-0.15.0.linux-amd64/ (查看创建的.my.cnf文件)
[root@localhost /]# cat /opt/mysqld_exporter-0.15.0.linux-amd64/.my.cnf

启动–丢与后台运行
[root@localhost /]# nohup /opt/mysqld_exporter-0.15.0.linux-amd64/mysqld_exporter –config.my-cnf=/opt/mysqld_exporter-0.15.0.linux-amd64/.my.cnf &

[root@localhost /]# netstat -tanp

注:也可配置systemd服务 用systemctl来管理mysqld_exporte…(可依以上配置systemd服务测试)
在prometheus主配置文件中添加监控
- job_name: ‘jchj_mysql’
static_configs: - targets: [‘gnode29:9104’]
重启prometheus服务
[root@localhost ~]# systemctl restart prometheus.service

通过浏览器直接访问,prometheus页面

- 监控远端机器(windows)
从官方网站进行下载window_node_exporter,
windows_exporter:Prometheus exporter for Windows machines – GitCode
windows_exporter-0.26.0-amd64

下载完成后,双击即可完成运行,但是这种方式需要将应用一直放置在前台运行,为了以后的管理,可以将应用注册为服务项
打开CMD命令,文件拖拽进去回车运行
C:\Users\Administrator>C:\Users\Administrator\Desktop\windows_exporter-0.26.0-amd64.msi

启动完成监控端口为3696

也可打开windows_exporter服务,使用鼠标右击点击属性按钮,在启动参数中添加–telemetry.addr=0.0.0.0:9182,更改端口,重启服务完成。
在prometheus主配置文件中添加监控。
- job_name: ‘jchj_windows’
static_configs: - targets: [‘10.0.20.6:9182’]
注:如有防火墙,都需要放行端口和地址
验证测试,通过浏览器直接访问,prometheus页面。

5、prometheus Grafana数据展示及告警
grafana安装
软件包获得
官方网站: grafana:https://grafana.com/

软件包安装。
[root@localhost ~]# yum install -y https://dl.grafana.com/enterprise/release/grafana-enterprise-11.2.0-1.x86_64.rpm

[root@localhost ~]# systemctl start grafana-server.service
[root@localhost ~]# systemctl status grafana-server.service
[root@localhost ~]# systemctl enable grafana-server.service
[root@localhost ~]# ss -tnl
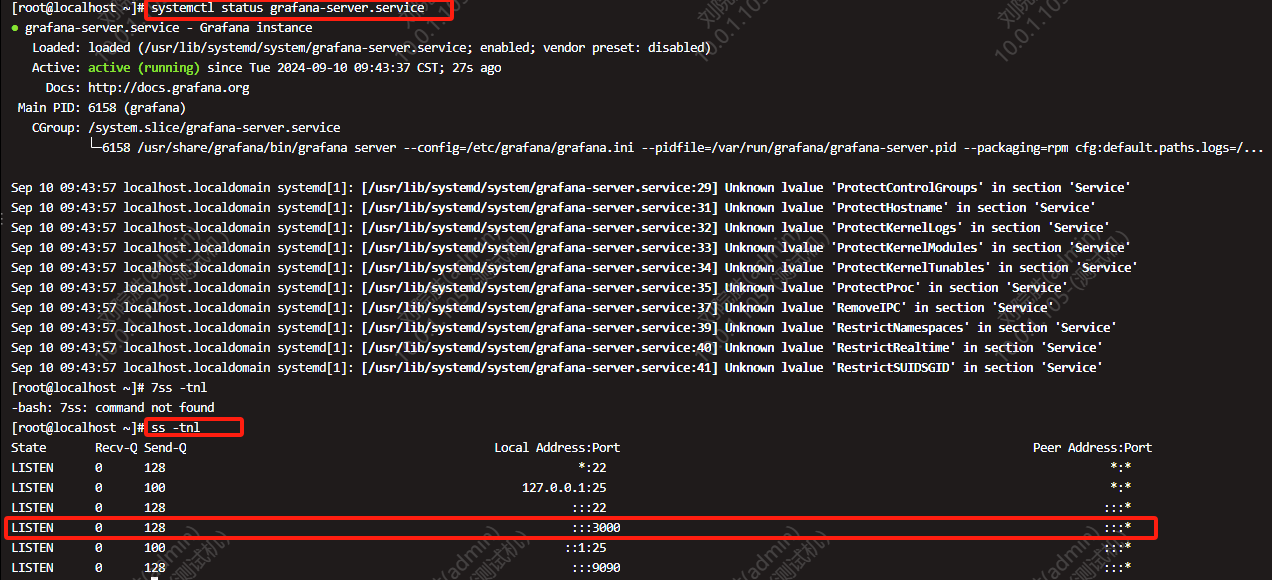
grafana启动成功后,可以通过页面访问到grafana页面
http://10.0.1.105:3000
要求输入账号密码: admin/admin(默认)
由于是第一次登录,为了安全要求必须更改密码后才能登录;

grafana页面设置-添加prometheus数据源
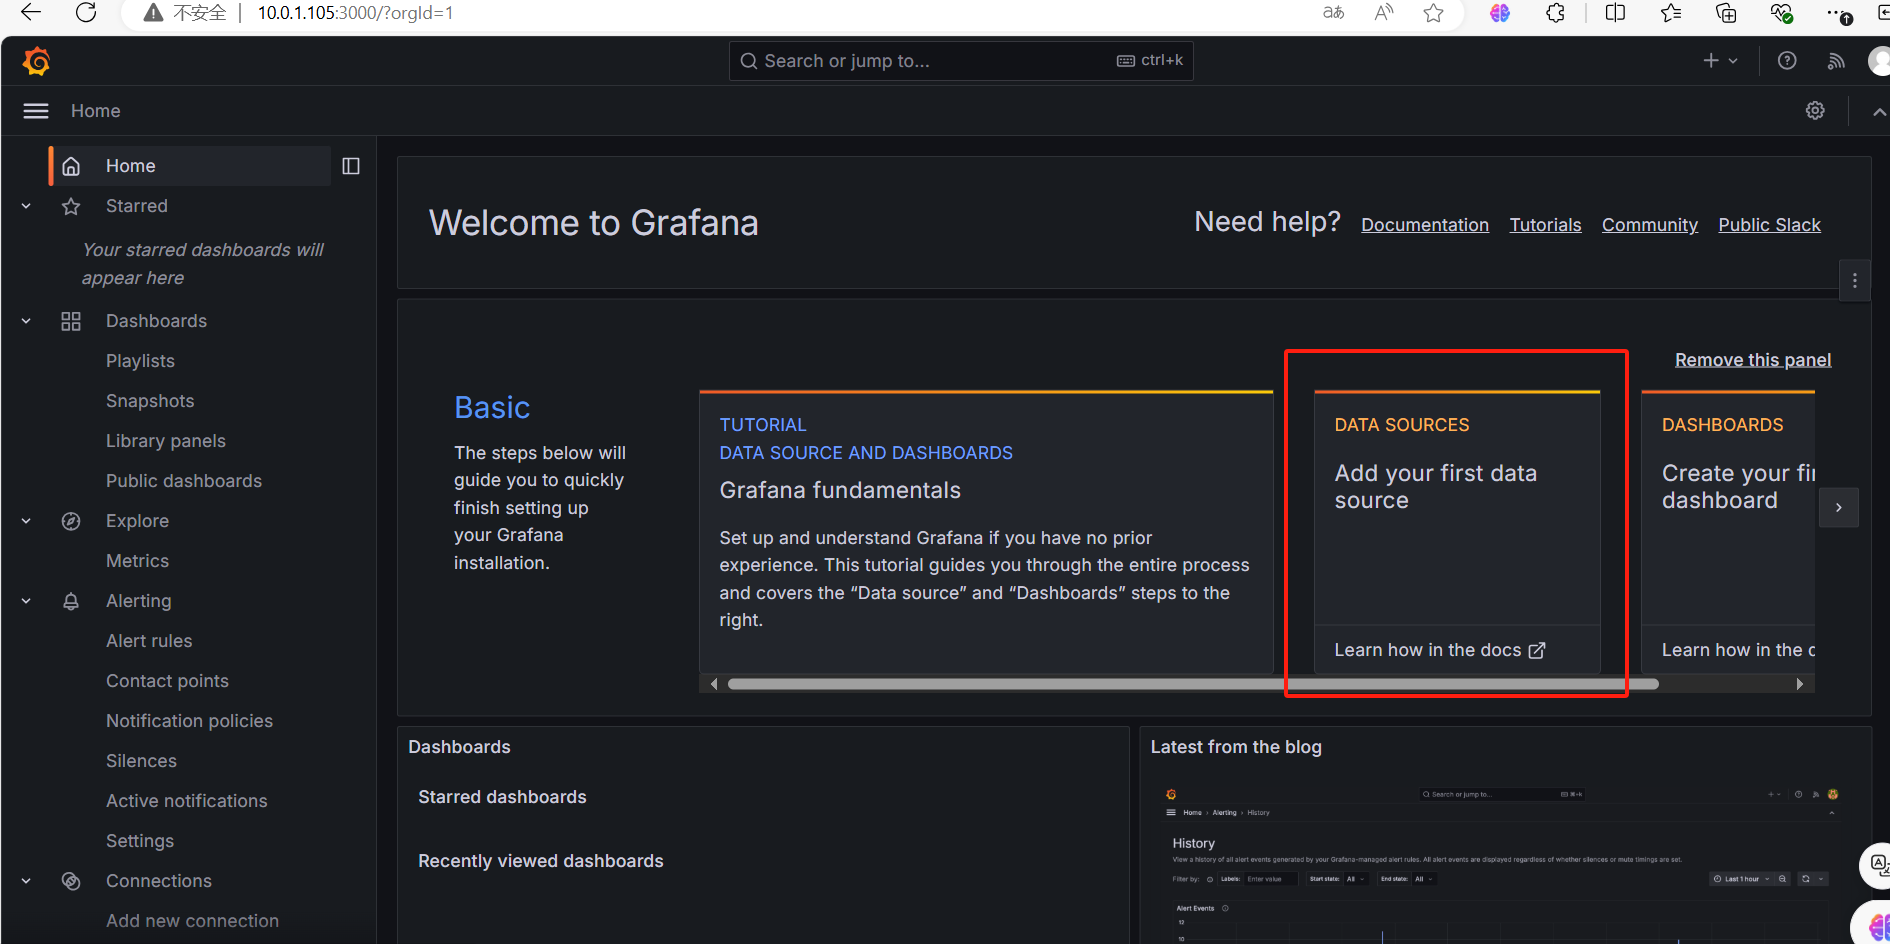
进入首页后;则出现以下页面,选择complete Add your first data source
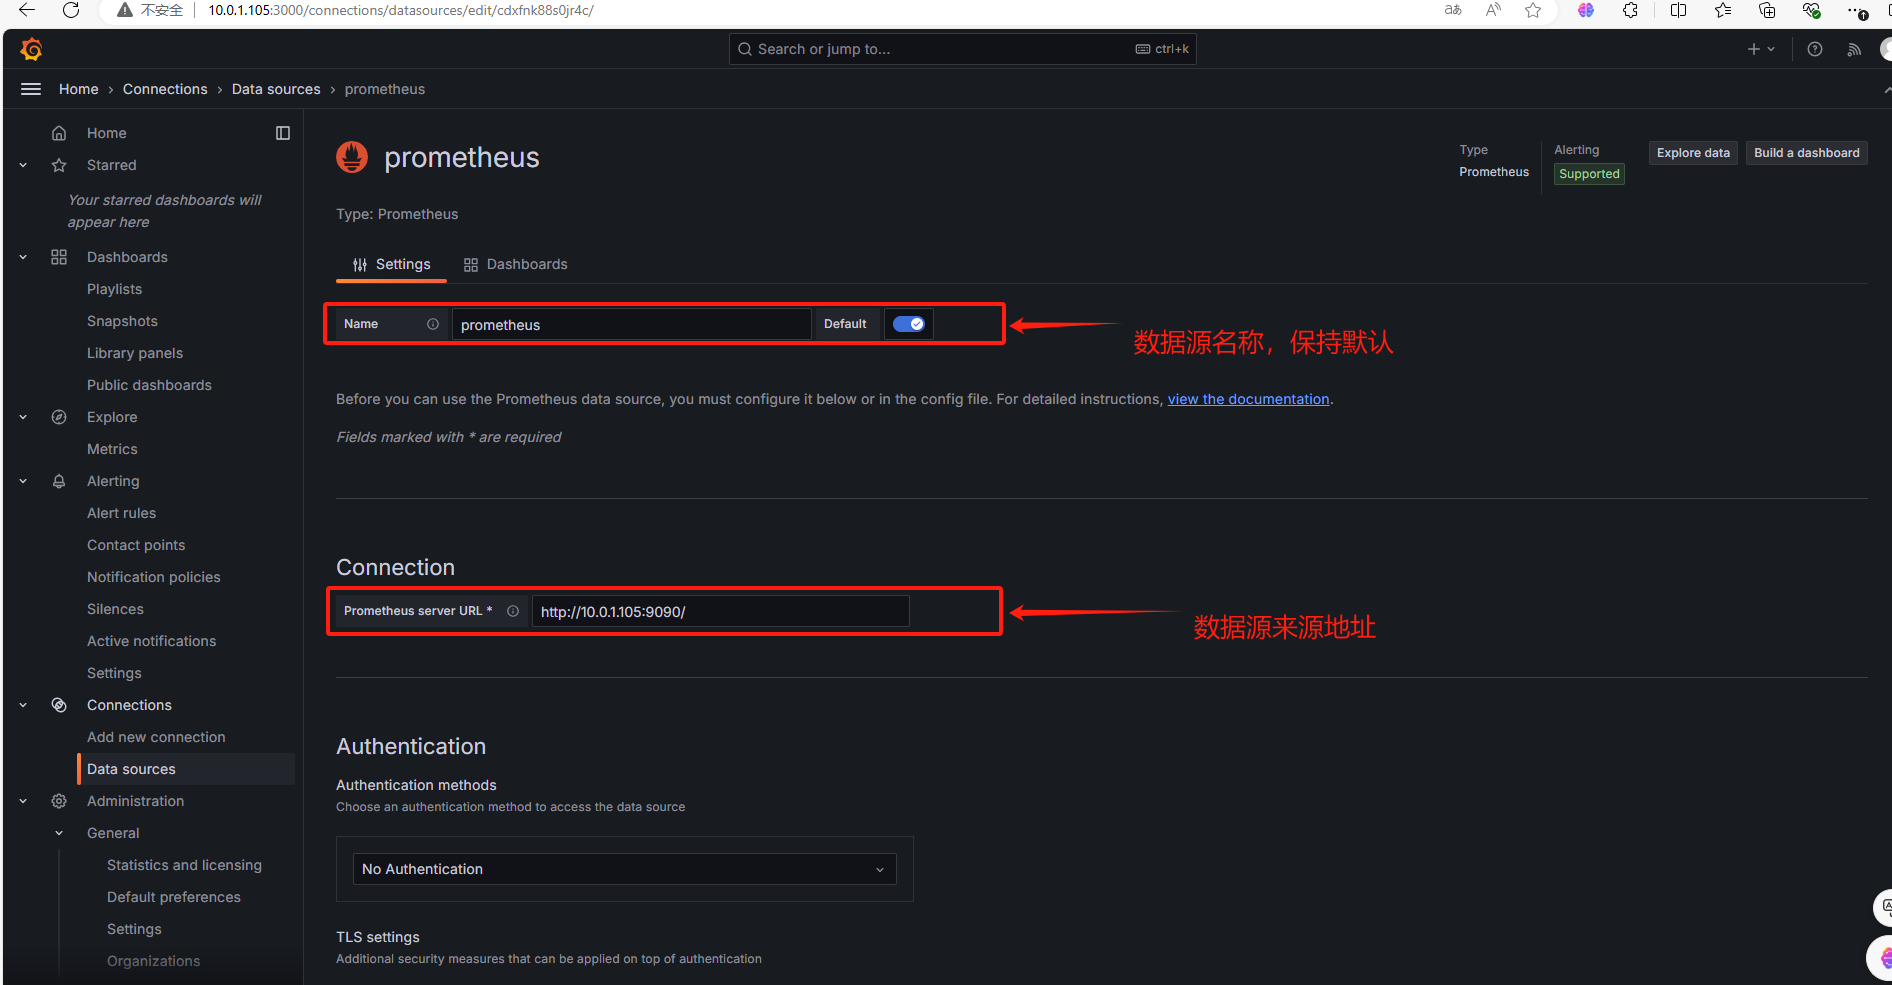
按照页面要求填入对应信息即可,一般错误都是因为输入错误造成的。点击Save & Test后保存成功

通过左侧导航栏中的齿轮图标下拉菜单中的Data Source看到刚才添加的数据源

绘制图形,添加仪表盘安装管理


选择导入仪表板(这里我只用的是9276模版)


导入成功后:进入首页选择刚导入的仪表版,可以看到数据显示出来了
关于模版:这里我们也可以去官网下载模版
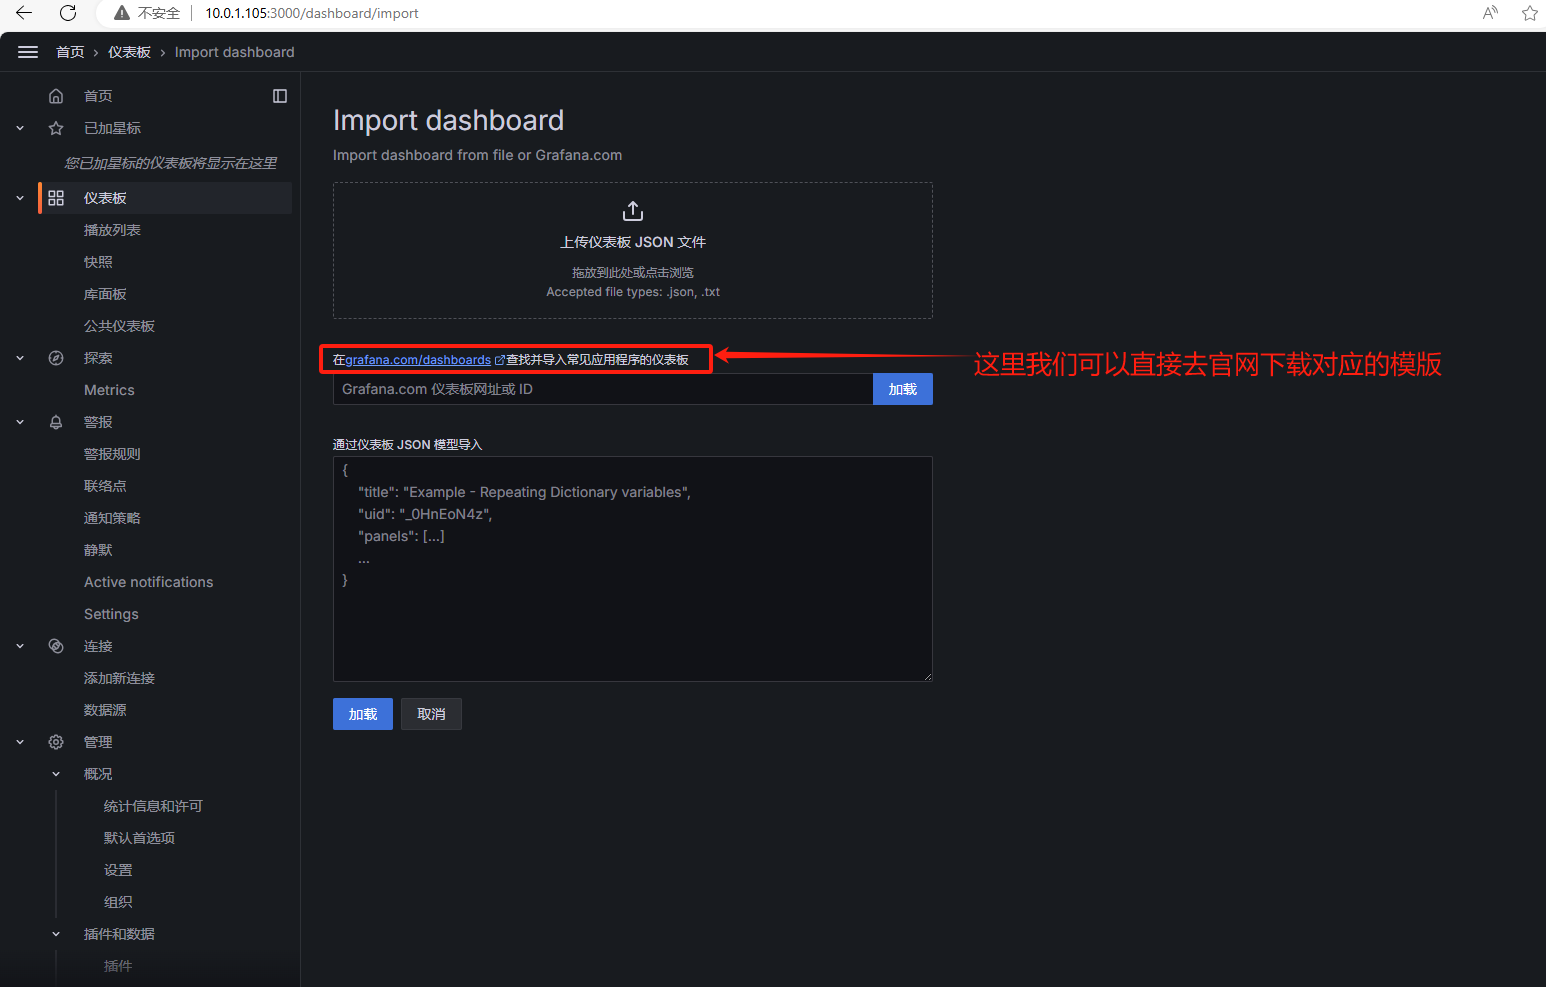
搜索对应的模版,复制模版ID直接导入即可。

